You can use filtering to limit the data and items in queries using values. Hierarchies can be filtered by a variety of different formulations like top or bottom count or percentage, according to the values (measures) or text (labels) in the current query.
Quick filtering (covered in this topic) offers a simple context-driven filtering option. The Filter wizard offers more sophisticated options to create filters with greater control over the filtering logic and mechanics. You can also use the Filter wizard to edit and refine the quick filters that you created here.
Understanding Filters and Slicers
Value filters should not be confused with slicer-based filters. Slicers filter content with reference to element selections; for example, on your Sales visual you can select USA from the country filter to show only sales data relating to the USA. Value filters (quick filters and filters created in the Filter wizard) filter data with reference to numerical or text limits; for example "Filter values above $500" or "Filter all states starting with 'New'."
- Click here for more information about value filters and slicers
Filter Types
The Quick Filter determines the overall filtering approach to be used on the targeted hierarchy or combination of hierarchies:
- By Count - The top or bottom n elements from a sorted list of elements based on numerical values.
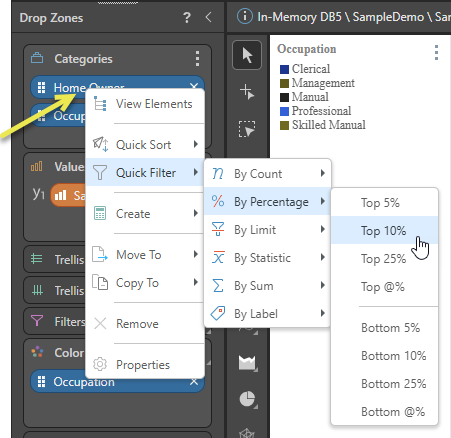
- By Percentage - The top or bottom n elements by percentage (that is, cumulatively larger or smaller than the provided percent figure of the result set).
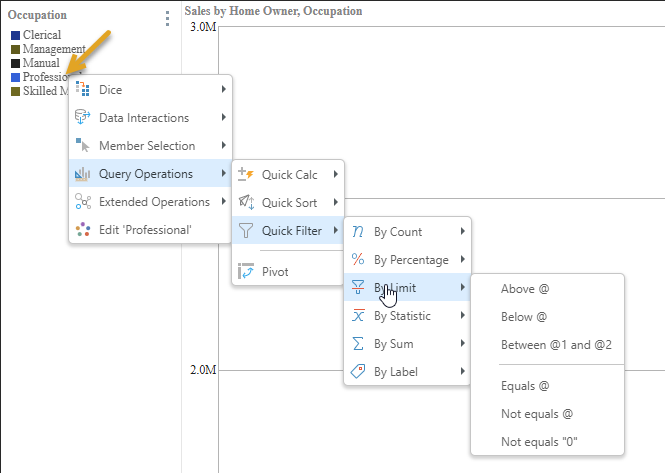
- By Limit - The elements that are above, below, equal to, or in between the provided figures of the result set.
- By Statistic - The elements that are above or below average or standard deviation statistics based on values in the result set.
- By Sum - The top or bottom elements that are cumulatively larger or smaller than the provided figure of the result set.
- By Label - The elements that have captions that match the text filtering criteria specified (this does not work on metric elements directly).
Note: Where only text filtering criteria are relevant (for example, on row headings), the submenu options are shown directly below Quick Filter ("By Label" is not shown).
Hard and soft filters
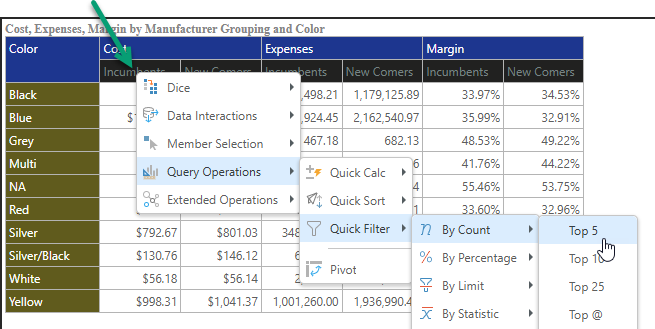
When you select a filter type from your context menu, a submenu opens with appropriate submenu options to select from. For example, select Quick Filter > By Count > Top 5 to filter the visual to show the top 5 elements by count. There are two types of filter:
- Hard limits are fixed filters that you do not need to customize. Options include Top 5, Bottom 10%, and even Above average. If you select one of these options, a background filter is added to your canvas, indicating that the visual is filtered.
- Soft limits are parameterized filters where you need to specify a custom value and where you can change your filter parameter on the fly. Soft filters contain an @ symbol on the limit menu; for example, Top @, Bottom @%, and Contains @. If you select one of these options, both a filter and slicer are added to your canvas and you need to use the slicer to set the custom value that should replace the @ "variable."
Adding a Quick Filter
Quick Filters are driven by the interactive clicks of the end user - so they take the context of the click into account when determining the 'ingredients' of the filter algorithm.
Note: The Quick Filter options may be under the Query Operations group on the context menu. The structure of your context menu depends on your settings in User Defaults. For more information, see Context Menu Configuration.
Context Menu
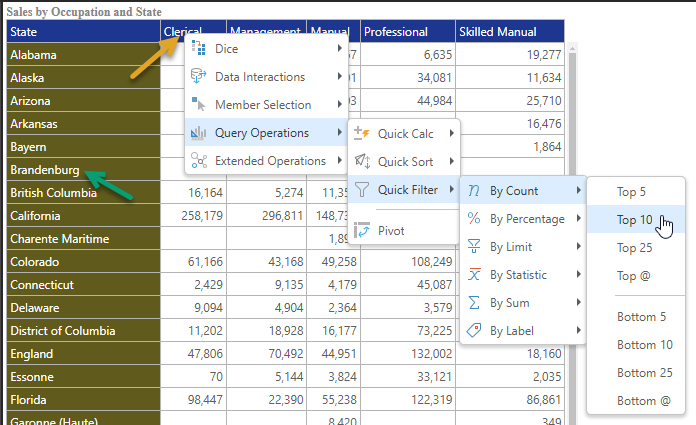
- To filter grids, right-click the column header (orange arrow) or row header (green arrow) and choose Query Operations > Quick Filter from the context menu:
- To filter charts, right-click an element label in the legend panel (orange arrow) to filter the x-axis. If you have multiple hierarchies in the chart, you can right-click the x-axis background to filter them.
Tip: If you want to apply one filter to all hierarchies in the query, right-click on a Measure header (instead of a hierarchy header), when working with grids.
Drop Zones
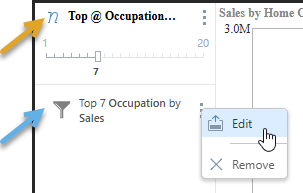
- To filter specific hierarchies (blue chips), right-click the blue chip in the drop zone (yellow arrow):
- To filter all hierarchies currently in the drop zone, select the Quick Filter options from the drop zones menu (green arrow):

Edit Quick Filters
You can review and edit quick filter selections from the Filter wizard. When you use the Filter wizard, you can access more filter types and more advanced settings for the basic types offered by the Quick Filter.
To open the Filter wizard, do one of the following:
- On the Query or Home ribbon, click Filter. For more information, see Value Filtering in Discover.
- With the Filter object selected on the canvas (blue arrow), click the ellipsis and select Edit:
Tip: The preceding example shows a "soft" filter (Top @). There are, therefore, two relevant objects on the canvas. The parameter (orange arrow), which indicates the current value for the soft filter, and the filter (blue arrow), which indicates the filter itself. Click the ellipsis associated with the Filter to Edit or Remove the filter. Click the ellipsis associated with the parameter to update its format and settings.
Delete Quick Filters
To delete quick filters, do one of the following:
- On the Query or Home ribbon, click Filter > Remove Filters. For more information, see Value Filtering in Discover.
- With the Filter object selected on the canvas (blue arrow above), click the ellipsis and select Remove. Note: This will remove the filter and any associated parameters.
Examples
- Right-click the header of the Cost / Incumbents column, and select Query Operations > Quick Filter > By Count > Top 5.
- Optionally, remove the filter by clicking the ellipse to the right of the filter (green arrow, above) and selecting Remove on the context menu.
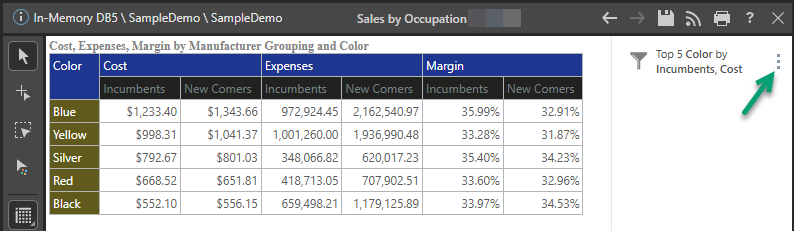
The grid is filtered to show the top 5 colors, based on incumbent cost. The definition of the filter is also shown on to the canvas to the side of the grid.
Using the same grid as the preceding example:
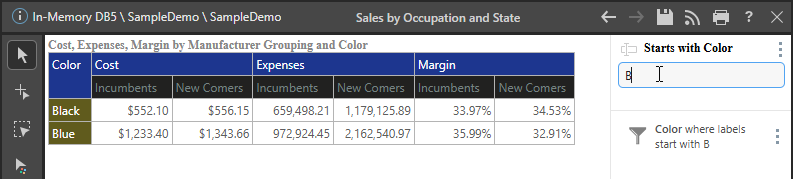
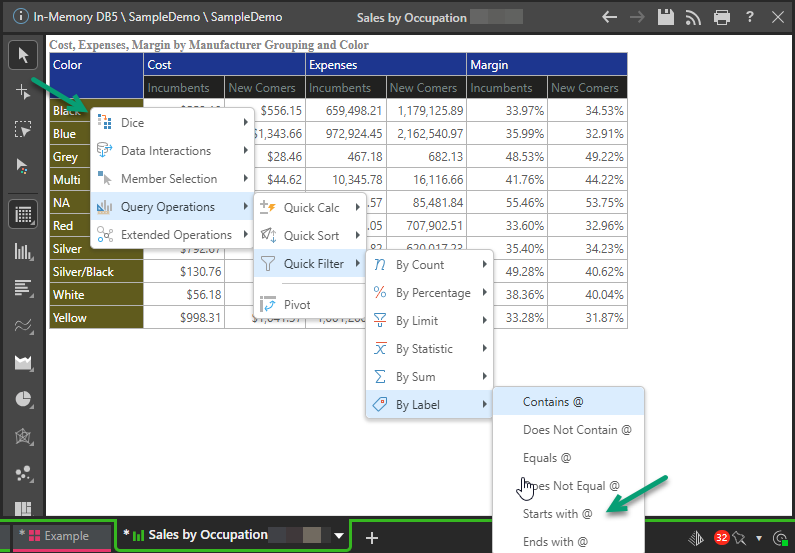
- Right-click one of the row elements (green arrow) and select Query Operations > Quick Filter > By Label > Starts with @.
- A Starts with text field.
- A filter object describing the text filter that is currently under construction.
- Type a search string into the text field (in this case, "B") and hit enter on your keyboard. The hierarchy is filtered to show only those colors whose names begin with a B:
Two objects are added to the canvas: